


Die wichtigste Frage der Welt – und die relativ simple Antwort darauf
Warum sind manche Länder reich und andere arm?

Der Nobelpreisträger Daron Acemoglu hat ein Paper geschrieben, in dem er eine Synthese seiner ganzen bisherigen Arbeit versucht.
Ein Fest für Ökonomie-Nerds.
Hier sei nur eine kurze Passage zitiert – die essentielle:
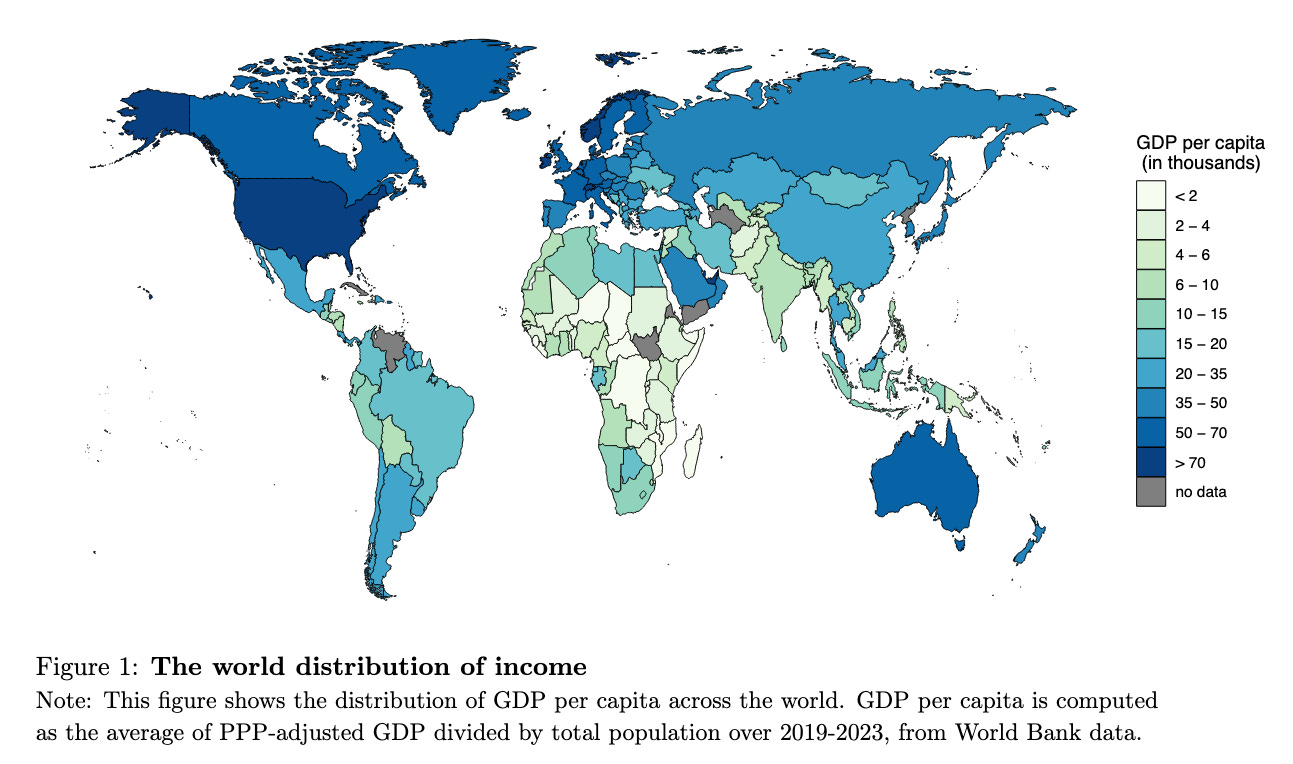
Figure 1 shows a heat map of the world, with colors reflecting GDP per capita today.
The 12 richest countries, which approximately correspond to the top decile of the prosperity distribution in the world and are shown in dark blue, have average GDP per capita that is about 63 times the average GDP per capita of the poorest 11 countries, approximately the bottom decile, shown in the lightest color.
I still believe that understanding how such jarring disparities can exist in a globalized, hyper-connected world is one of the most intriguing questions of social science.
Woran liegt das?
Es hängt stark von Anreizen ab, die Menschen in diesen Ländern haben.
In sicheren Ländern mit Rechtsstaat hat man den Anreiz, innovativ und fleißig zu sein, damit man wohlhabender wird.
In unsicheren Ländern ohne Rechtsstaat hat man den Anreiz, andere Menschen auszurauben, damit man wohlhabender wird.
So könnte man seine Institutionen extrem verkürzt darstellen.
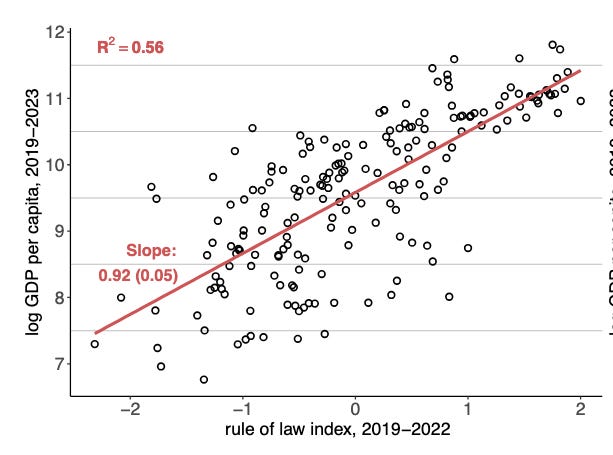
Die Empirie gibt das auch tatsächlich her, wie nachfolgende Grafik zeigt.
Je weiter rechts oben ein Kügelchen (=ein Staat) ist, desto besser ist dort der Rechtsstaat (=die Anreize) und desto höher ist das BIP pro Kopf.
Acemoglu schreibt:
Figure 2 shows the present-day correlation between (log) GDP per capita and a broad measure of institutions, the "rule of law" index from the World Bank, proxying for the extent to which arbitrary use of economic or political power is constrained by well-defined laws that apply to all citizens and organizations in a country.
Like all omnibus measures, this one is subject to several potential criticisms, but most of the available proxies are highly correlated with each other and appear to capture a major common component of institutional differences.
Hier die Beschreibung der Weltbank des Rechtsstaatsindikators, der statistisch mehr als die Hälfte der Einkommensunterschiede zwischen den Ländern erklären kann:
Rule of Law captures perceptions of the extent to which agents have confidence in and abide by the rules of society, and in particular the quality of contract enforcement, property rights, the police, and the courts, as well as the likelihood of crime and violence.
Percentile rank indicates the country's rank among all countries covered by the aggregate indicator, with 0 corresponding to lowest rank, and 100 to highest rank.
Ich habe kurz online gecheckt: Wer schneidet wie ab?
Top 10:
Finnland (100)
Dänemark (100)
Norwegen (99)
Schweiz (99)
Singapur (98)
Luxemburg (98)
Österreich (97)
Island (97)
Liechtenstein (96)
Neuseeland (96)
Letzten 10:
Turkmenistan (7)
Myanmar (6)
Nordkorea (6)
Afghanistan (5)
Demokratische Republik Kongo (5)
Sudan (4)
Irak (4)
Zentralafrikanische Republik (3)
Eritrea (3)
Libyen, Jemen, Syrien, Südsudan, Venezuela, Somalia (0-2)
Spannend: Die USA kommen auf einen Wert von 89. Hongkong auf 88. China auf 53.
Man kann es nicht oft genug sagen: Wir sind gesegnet, in Österreich zu leben (97).
Dass fast ein Drittel der Wähler:innen einer Partei ihre Stimme gab, die den Rechtsstaat beschneiden möchte, spricht nicht dafür, dass das allen klar ist.